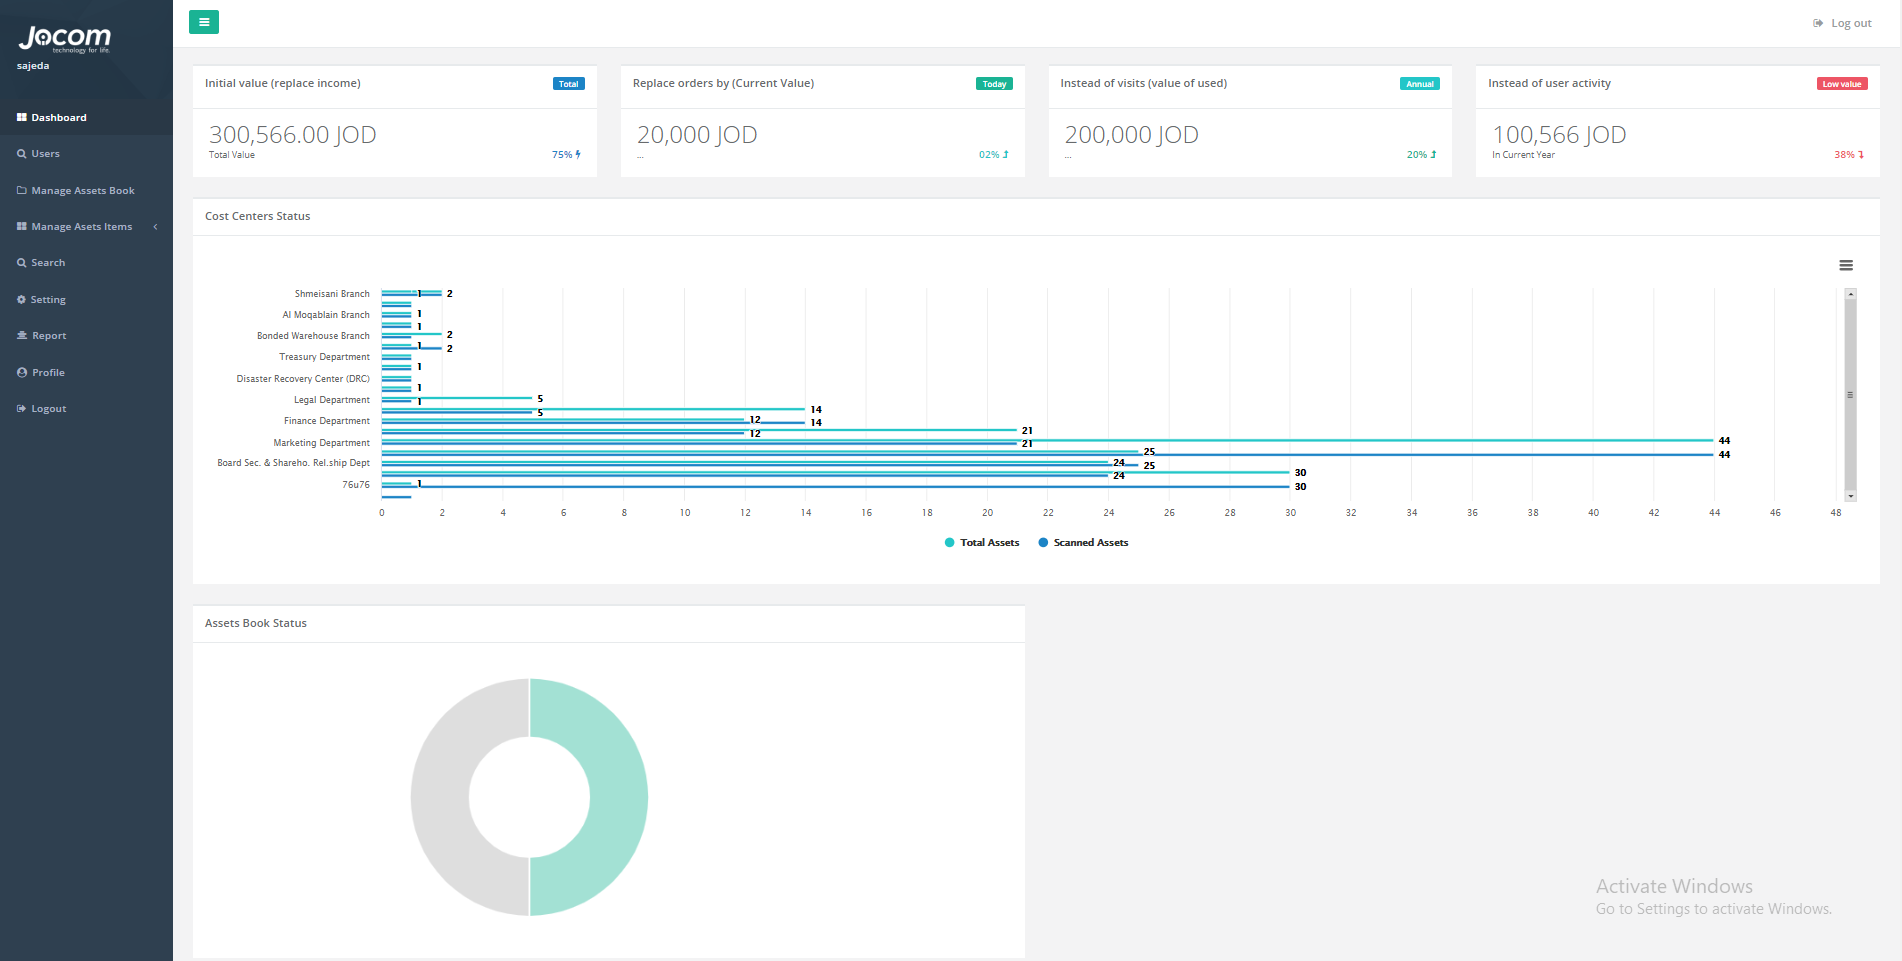
Dashboard page
Estimated reading time:

After logging in to the website the page will be displayed to the user is the dashboard page, this page contains some shortcuts to other system pages.
The dashboard page will contain the following:
1. The side bar: this side bar will contain the link to all other page of our website.
2. Charts: the charts are to display some required statistics of the system data. The applied charts are the following:
1. Cost centers status bar chart: this chart will show the number of assets for each cost center and the number of scanned of them.
2. Asset book status pie chart: this chart shows the number of scanned and not scanned assets for the active copy.
3. Devices location map: this map view will show the location of all our users’ device, they will be shown as pins on the map, these pins will be clickable, and by clicking on them, the information of the user will be displayed in a preview box.
3. Logout button: the user can logout of the website using this button, after pressing this button the website will transfer the user to the login page.
