End of Zendesk Widget script
+962 (6) 4643896 Software@jocom.jo
0 Items
JOCOM Software
  • Software
  • Products
    • Ecommerce
    • Fixed Assets
    • Ticketing
    • Customer Feedback
  • Odoo ERP
  • Services
  • Customers
  • Support
  • About Us
    • Careers
    • Contact Us
  • English
    • العربية
Select Page
  • Mobile Portal

    • User Guide

    • Fixed assets mobile application

    • Login

    • Home page

    • Side bar

    • Add item page

    • Scan page

    • List page

    • Search Page

    • Transfer to web

    • Check tag page

    • Settings

    • Dashboard

  • Web Portal

    • Search

    • User Guide

    • Fixed assets website system

    • Login page

    • Forgot password page

    • Dashboard page

    • Users

    • Manage assets book

      • View book assets
      • Manage assets items
      • Add assets
      • Import assets
      • Manage assets
      • View asset information
      • Assets wrong location
    • Settings

    • Profile

  1. Docs
  2. Assets Tracking - RFID
  3. Mobile Portal
  4. Dashboard

Dashboard

Estimated reading time:

The dashboard page is where all the statistic of the company’s fixed assets are previewed in charts, there will be a various type of charts to be previewed in the dashboard, each one with its own data to view.

These system dashboards will define the followings:

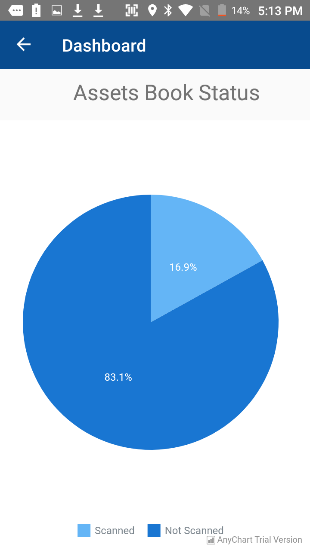
1.      Assets book status pie chart: this pie chart shows the percentage of scanned and not scanned assets of the current fixed assets book.

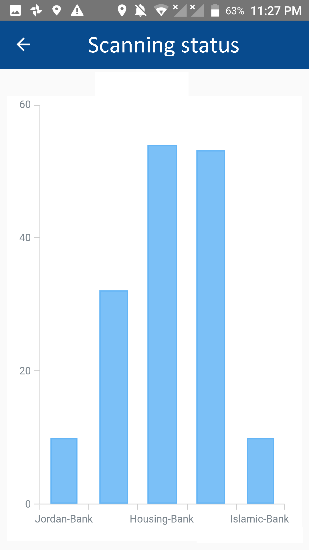
2.      Scanning status bar chart: this bar chart shows the number of scanned assets per each cost center of the company.

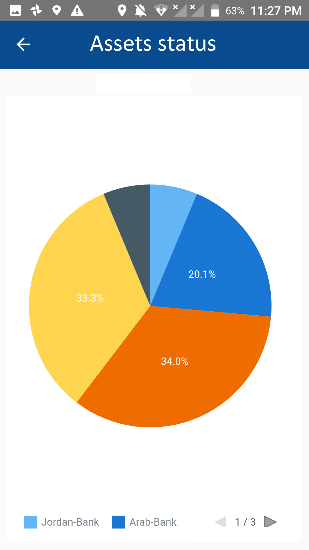
3.      Assets status pie chart: this pie chart shows the percentage of assets for each cost center of the company.

Last update: 01/17/2021
Views: 410
How do you feel about this article ?
0 0 0
In this page:
    © 2024 JOCOM , All rights reserved
    Open chat